

Pre-requirements:
Have the Minikube installed and working already. See the post How to install Minikube with UI in the MacOsX? in order to achieve it.
Steps to install
- Run the following command:
minikube delete && minikube start –vm-driver hyperkit –kubernetes-version=v1.14.4 –memory=4096 –bootstrapper=kubeadm –extra-config=kubelet.authentication-token-webhook=true –extra-config=kubelet.authorization-mode=Webhook –extra-config=scheduler.address=0.0.0.0 –extra-config=controller-manager.address=0.0.0.0
NOTE: If you are not using hyperkit just change the –vm-driver or do not add it to use the default one.
- Run :
minikube addons disable metrics-server
- Clone the project https://github.com/coreos/kube-prometheus
- Then, run the following command until all be succeeded:
kubectl create -f manifests/
Prometheus:
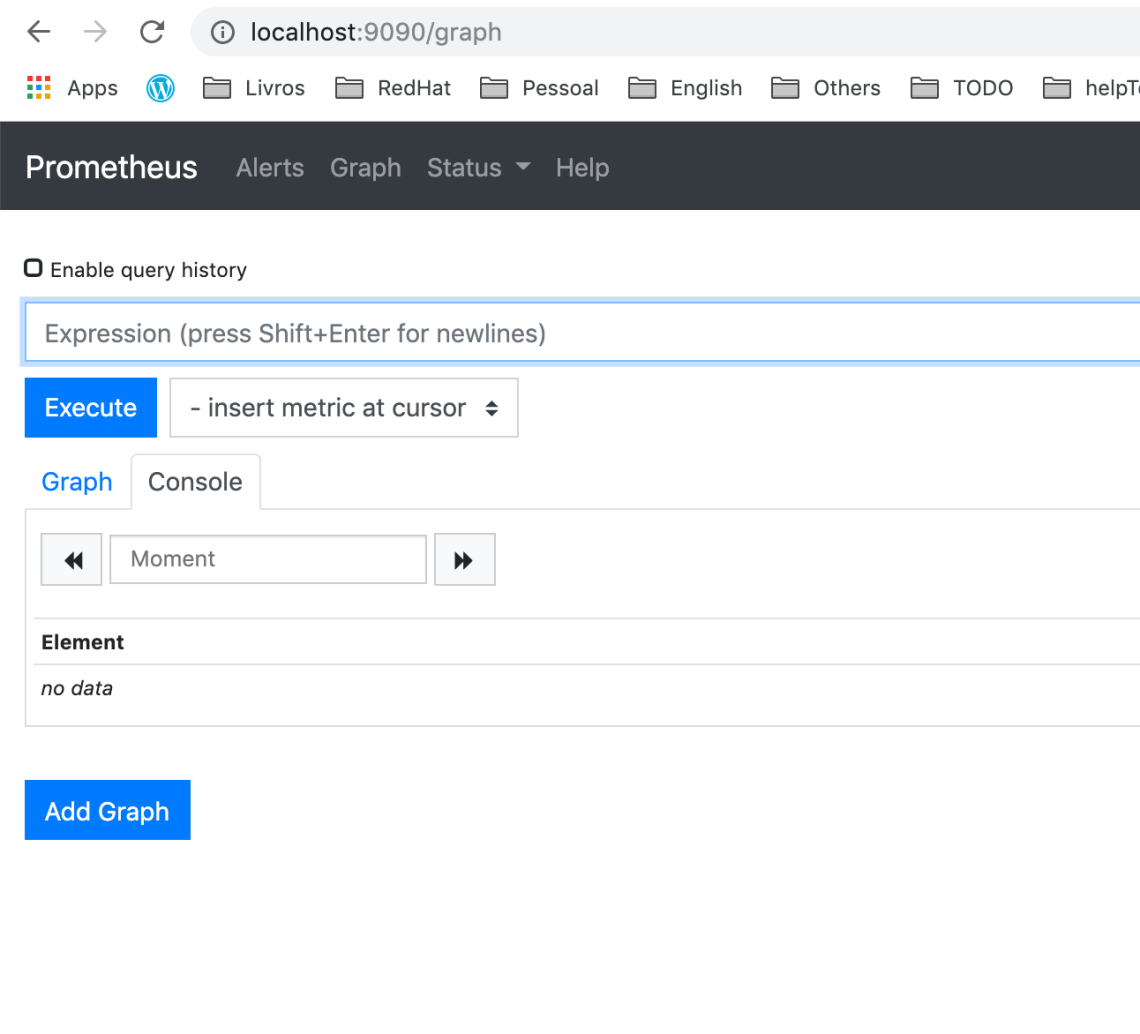
- Run the following command to expose the Prometheus UI/service.
kubectl –namespace monitoring port-forward svc/prometheus-k8s 9090
- Then, access the Prometheus via http://localhost:9090
Grafana
- Run the following command to expose the Grafana UI/service.
$ kubectl --namespace monitoring port-forward svc/grafana 3000
- Then access via http://localhost:3000 and use the default grafana user:password of
admin:admin.
Alert Manager
- Run the following command to expose the Alert Manager UI/service.
$ kubectl --namespace monitoring port-forward svc/alertmanager-main 9093
- Then access via http://localhost:9093
