

Pre-requistes
- Intellij IDE chrome extension installed.
*Note: If you don’t have this tool installed follow the link below.
https://www.jetbrains.com/help/webstorm/2016.3/using-jetbrains-chrome-extension.html
Steps to Set Up
- Set up your server/application as NodeJS
- Click into `Edit Configurations`
- + Add new Configuration
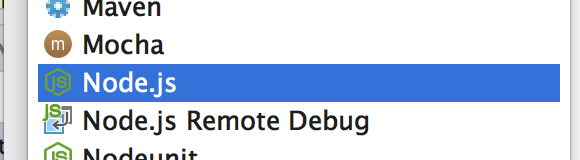
- Choose your Node Interpreter;
- Add the script which is used to run your application
Example:


- Set the URL for your debug:
Default value for WebPack projects: “http://localhost:63342/<project_name>/build_dir”
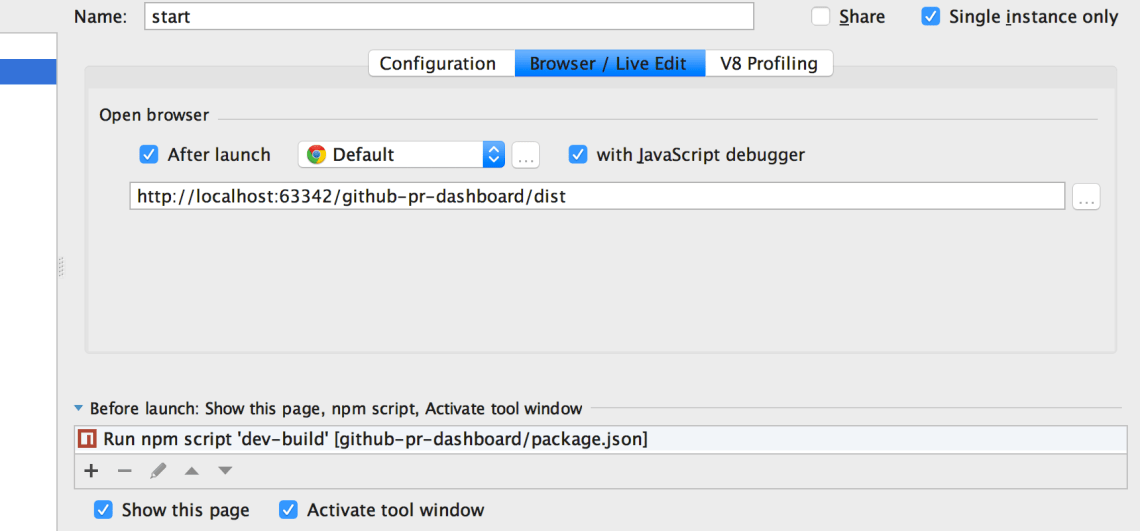
*Note: Build directory is the value defined in the output section in webpack.config.js file.
Example :
output: {
  path: './dist',
  filename: 'bundle.js'
},
- Configure to the IDE exclude your build directories.

- Now you can run it and debug as the following is showing.
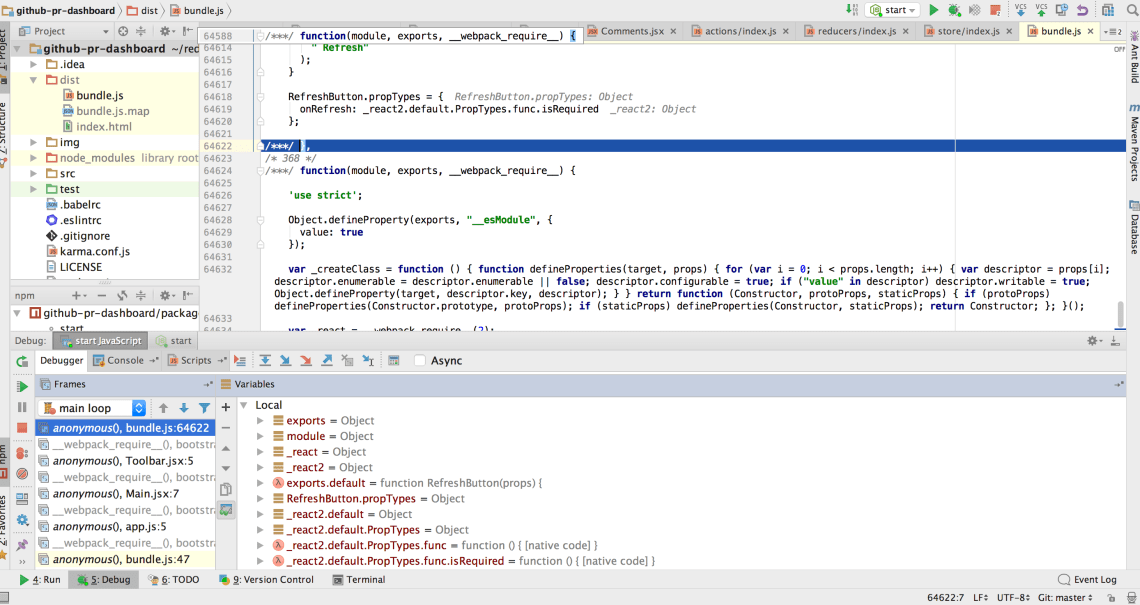
Note: Check the source-map defined in the `devtool` section into webpack.config.js file. Check the following link to understand better your options of dev tool.
https://webpack.github.io/docs/configuration.html
